Loading component...
At a glance
Opening CSV files
Excel has always been able to open comma separated values (CSV) files. CSV files can hold large amounts of data in a relatively small file size. Most operating systems can export data into a CSV format.
Historically, when Excel has opened CSV files, it would make “assumptions” about the data. This often meant that it would automatically convert certain data types into incorrect data types, and the user could not control these conversions.
This meant that the data that had been imported into Excel may not have matched the raw data in the CSV file.
The most common conversion problem involves removing leading zeroes from numbers. This can cause major issues with account numbers and mobile phone numbers.
Only certain data types were affected. Power Query (in the Data ribbon tab) is often used to handle CSV imports so that the raw data is treated correctly, but a recent update to Excel has given users the ability to ignore the standard CSV import assumptions and to bring in the CSV raw data “as is”.
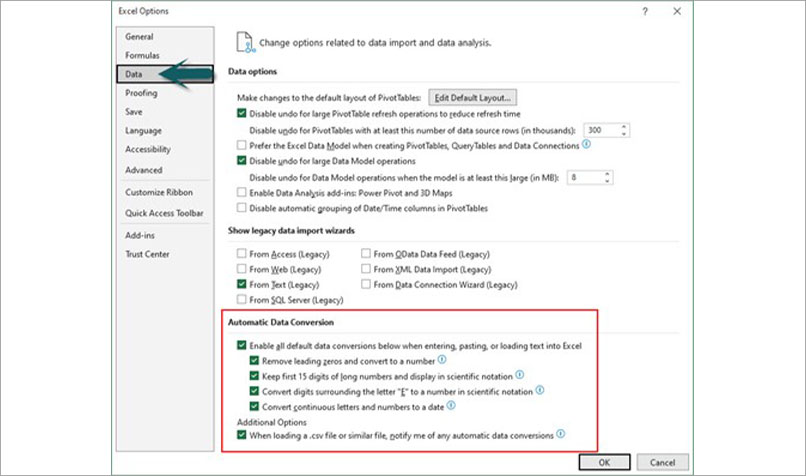
In the Excel Options dialog in the File ribbon tab, under the Data option (top left), the user can now turn off certain assumptions or turn them all off – see the section marked in red in Figure 1.
MAP function
This function has nothing to do with maps. The MAP function allows the user to access all the individual cells within a range or a spill range. Its main advantage is to enable spilling for the logic functions OR and AND.
It also reduces the need for helper columns as the MAP function can handle multiple ranges.
The user can refer to a range in Excel formulas and perform many calculations. Sometimes, however, logic functions do not spill to match the range, which is where the MAP function comes in.
Figure 2 has a logic formula in cell C2 that spills down the column.
Power Query is still the most important data tool for importing CSV files, and it has many built-in automatic data cleansing and correction features.
New functions
These three new functions – MAP, SCAN and REDUCE – require the use of the LAMBDA function to return results.
The LAMBDA function accepts inputs via variables. The variables can then be used in a formula to provide a result.
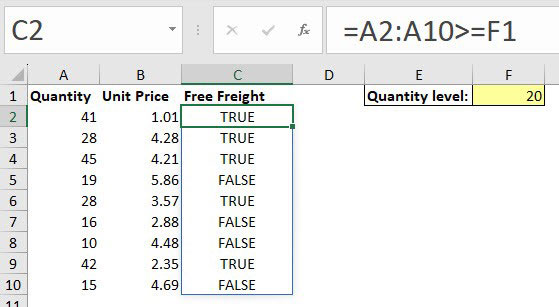
The thin blue outline in Figure 2 defines the spill range. The formula is entered in cell C2 and spills down to populate the cells beneath to match the rows in the range A2:A10.
The formula displays TRUE if the quantity in column A is greater than or equal to 20 (the value entered in cell F1). TRUE means freight is free.
Unfortunately, the functions OR and AND do not spill when they are included in the above formula – see Figure 3.
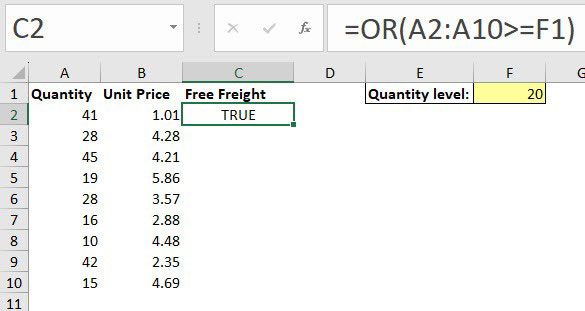
This formula is returning TRUE based on the whole range rather than just the entry on row 2. The MAP function can force this OR function to spill down and to work on each individual cell in turn.
The examples that follow use the OR function, but the technique also applies to the AND function.
Syntax:
MAP(array, lambda or array2)
| array | This is the range to work with, and it can be vertical, horizontal or two-dimensional. It can also be a normal range reference, like A2:A10, or a spill range reference, like A2#. To refer to more than one range, separate the ranges with commas. |
| lambda array2 | The last argument in a MAP function must be a LAMBDA function. The LAMBDA function must include one variable for each array (range) included. |
The formula in cell C2 in Figure 4 has a range as the first argument. This range is passed to the LAMBDA function as the qty variable, one cell at a time.
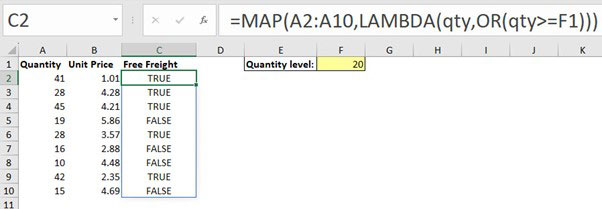
The OR function then compares each qty value to the value in cell F1 and returns either TRUE or FALSE. The formula spills down to match the rows in the range.
Now the formula works just like the one in Figure 2.
An OR function usually has multiple logical tests. If any of the logical tests return TRUE, then the OR returns TRUE. The only time an OR function returns FALSE is if all the logical tests return FALSE.
If there are two conditions to decide whether freight is free, another condition can be included in the OR function. The two conditions are:
- If the quantity is above 20 (cell F1)
OR
- The extended value (quantity times unit price) is above $100 (cell F2).
Figure 5 has the formula that will enable that calculation.

The MAP function passes two separate ranges to the LAMBDA function. The LAMBDA function uses the variables qty and unitprice to capture the two ranges.
The OR function then compares the qty range to cell F1. It also multiplies the qty and unitprice ranges together on a row-by-row and cell-by-cell basis and compares the result to cell F2.
Row 5 has a quantity of 19 and is returning TRUE, because the extended value is above the $100 value threshold.
Note that there were no $ signs used in any of these formulas – spill formulas require fewer $ signs to fix the cell or range references.
SCAN and REDUCE functions
The next two new functions use the same syntax, but their output differs. They both accumulate a value. The SCAN function returns each accumulated value in a spill range like a running total. The REDUCE function returns only the final value.
Syntax:
SCAN(initial_value,array,function)
REDUCE(initial_value,array,function)
| initial_value | This is the starting value for the accumulation. This could be a cell reference or a value like 0 or 1 or text like "" for a blank. |
| array | This is the range to work with, and it can be vertical, horizontal or two-dimensional. It can also be a normal range reference, like A2:A10, or a spill range reference, like A2#. |
| function | This is a LAMBDA function that has two variables and a calculation. The first variable is for the initial_value. The second variable is for each cell from the array (range). The LAMBDA then performs a calculation based on the variables. The value or entry created by each LAMBDA calculation is then transferred to the first variable for the next calculation to build the accumulation. |
SCAN displays each result of the LAMBDA calculation like a running total, while the REDUCE function only displays the result of the final calculation. The following examples demonstrate how these two functions work.
Example 1: Running total
The SCAN function can perform a single formula running total. Figure 6 shows month-by-month amounts in column B. The formula in cell C2 spills down and provides a cumulative running total.
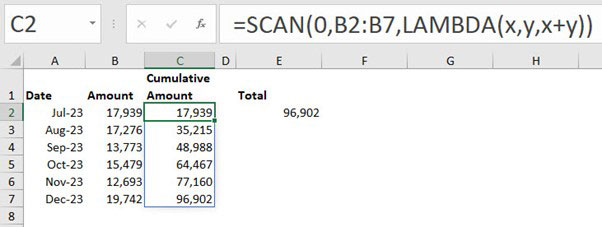
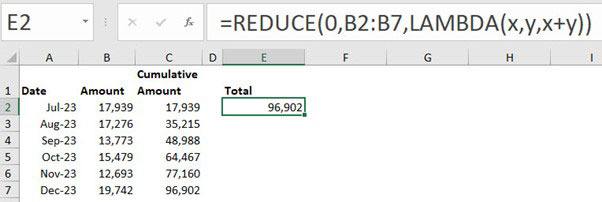
Both these functions return cumulative results. The difference is that SCAN returns all the interim cumulative results, while REDUCE returns only the final cumulative result. Figure 7 shows the REDUCE function in cell E2.
How they work
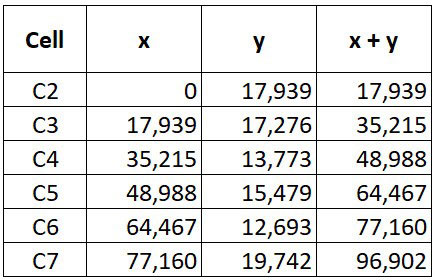
The LAMBDA function accepts two variables. The first variable accepts the initial_value, and then it accepts the result of each cell’s calculation. Figure 8 shows the value in each variable and the calculation result (x + y) for each cell.
The SCAN function displays each result, cell by cell, in a spill range, while REDUCE displays the result of all the calculations in a single cell.
Example 2: Text
In Figure 9, the formula in cell B2 spills down to build a text string. This eventually creates the text string CPA AUSTRALIA.
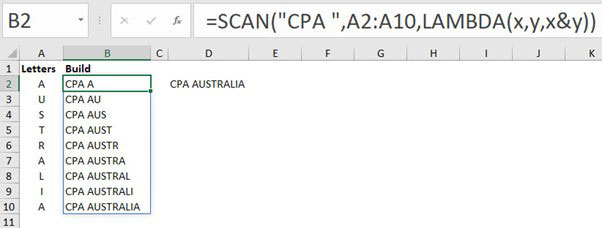
The initial value in the SCAN function is the text CPA followed by a space. All text must be enclosed within quotation marks.
The & symbol used in the LAMBDA calculation joins text together. In cell B2, it creates the text string CPA A and then, as the formula spills down, it progressively adds each letter from the range in column A to the text until it finishes with CPA AUSTRALIA.
In Figure 10, the formula in cell D2 shows the REDUCE function returning the completed text string.


