Loading component...
At a glance
This is part 2 of a 3-part series. See part 1 and part 3 here.
Python is a popular modern programming language. A recent upgrade to Excel has now made it possible to use Python code inside an Excel cell.
This is the second in a three-part series on Python in Excel:
- Part 1: The basics
- Part 2: Starting to code
- Part 3: Application in Excel
This article assumes you have read part 1.
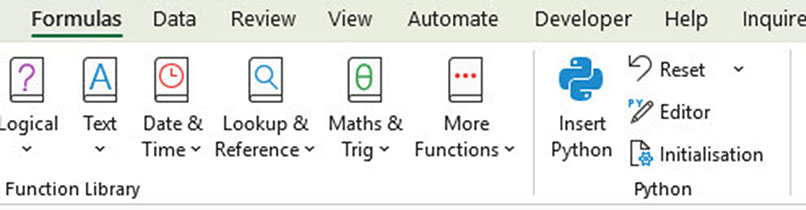
Python is in the Formulas tab — see Figure 1.
Initialisation
Python in Excel comes with several external libraries already installed. These add extra functionality to Python.
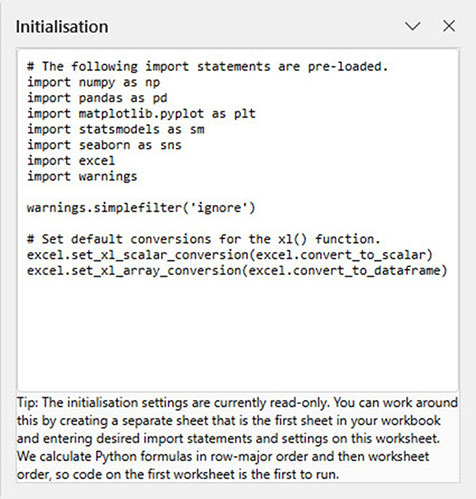
If you click on the Initialisation icon, a separate task pane appears on the right of screen. The task pane shows those external libraries — see Figure 2.
The imported names such as “numpy” and “pandas” are external libraries that contain pre-built functionality for specific tasks. The libraries are not standard in Python, and must be imported to access them. They are like Add-ins in Excel.
To access the library’s functionality, you use the variable defined on the end of the import line. Use the pd variable to access the functionality for Pandas.
Installed Python libraries and what they do
numpy — scientific and mathematical computing functionality.
pandas — data table and data analysis functionality. With Pandas, a data table is called a DataFrame. The pd variable will be used in the worked example in this article.
matplotlib — data visualisation (charting) functionality.
statsmodel — statistical analysis functionality.
seaborn — statistical data visualisation (charting) functionality.
Worked example
Figure 3 has two formatted tables. The left (green) table is named tblOrders and the right (blue) table is named tblProducts.
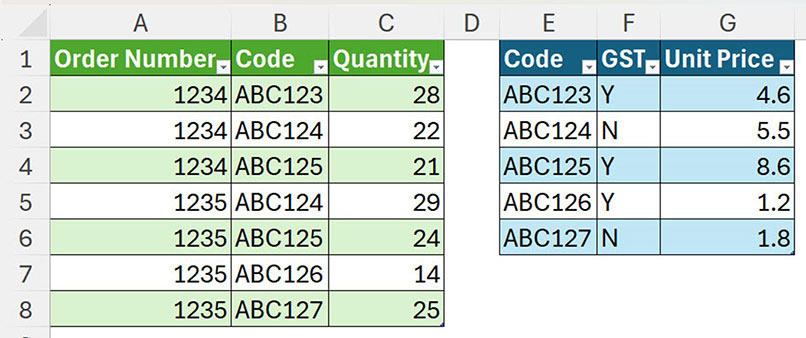
The challenge is to combine these two tables to work out the order value and the GST amount.
Excel could use functions and formulas, Power Query or the Data Model to solve this challenge. Python now offers another solution. The Pandas library enables you to easily merge tables together.
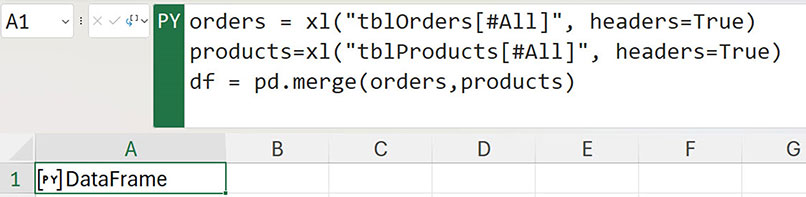
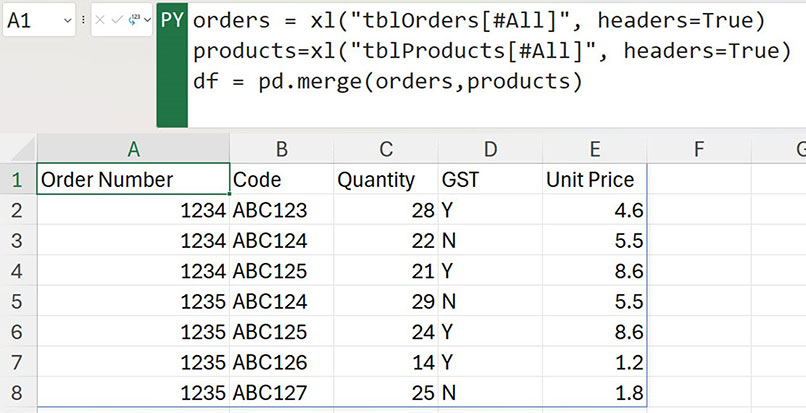
In a separate sheet, see the Python code in cell A1 (Figure 4) that merges the two tables together. Note that Python recognises the formatted table names. The headers = True command allows you to reference columns via the column headings.
Case sensitive
Python is a case sensitive language. Most entries are in lower case. Note that the word True was capitalised.
Even though there is a lot of text in the formula, most of it is entered by Excel.
To create this Python cell, follow these steps.
- Type =PY and pressed Tab.
- Type orders = and use the mouse to the select the left-hand table in Figure 3. Excel enters the xl() code.
- Press Enter.
- Type products = and use the mouse to select the right-hand table from Figure 3.
- Press Enter.
- Type df = pd.merge(orders,products) and pressed Ctrl + Enter to accept the code.
Note: the df variable is commonly used to capture a Panda DataFrame.
The command pd.merge(orders,products) uses the merge function from the Pandas library. It combines the two tables based on the Code field that is in each table.
The default setting is to display the word DataFrame when a table is created. To display the completed table, click the icon on the left of the green PY colour and choose Excel Value — see Figure 5.
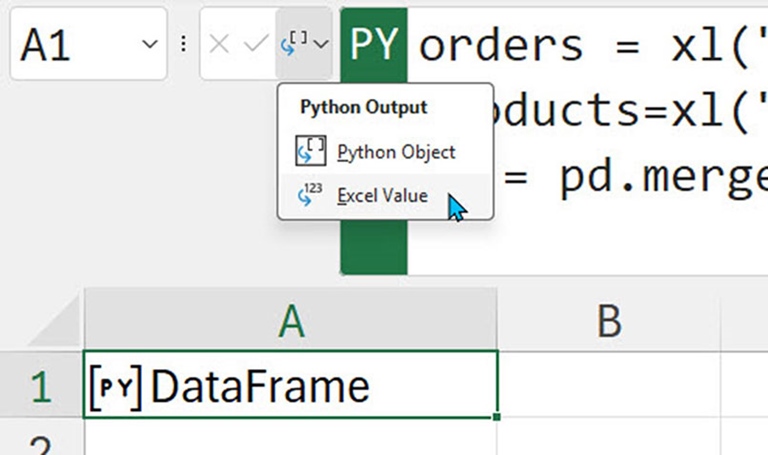
The table will display — see Figure 6.
This Python formula spills down and across like a dynamic array to populate the range. The cells below and to the right must be empty for the table to display. The #SPILL! error will display if the cells are not empty.
Alternative merge
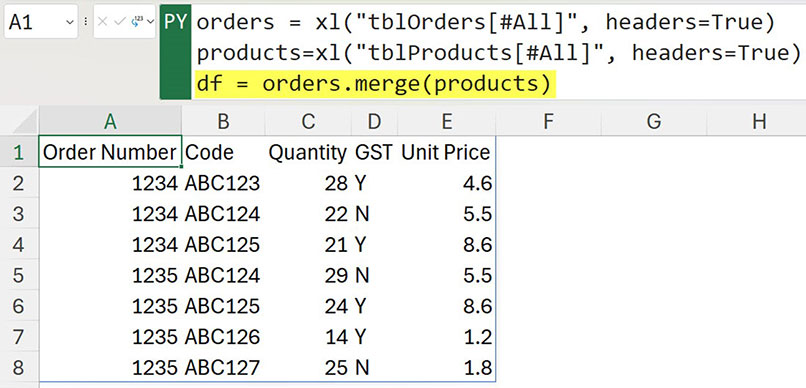
Since the orders variable is a Pandas DataFrame, the merge method can be used with it to merge the tables together — see the yellow highlighted code line in Figure 7.
Calculating sales
The df variable is accessible to Python cells in the rest of the sheet. Cell A1 has been reverted to a Python Object as per Figure 5.
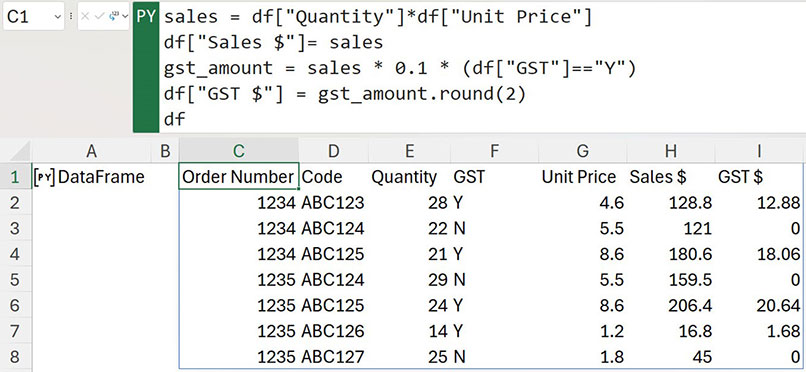
In Figure 8, the Python formula in cell C1 shows how to use the df variable from cell A1 to calculate, insert and display the sales values in a new table.
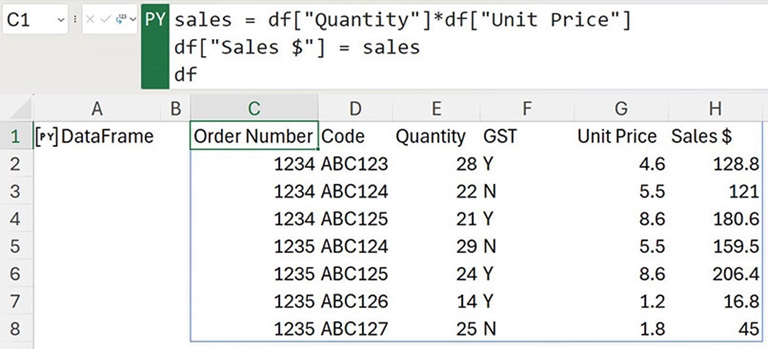
The formula in cell C1 was typed in.
To refer to a column in a DataFrame, use the square brackets and enclose the column name in quotation marks. The first line multiplies each quantity by each unit price to calculate the sales amount for each line, and captures the values in the sales variable.
The second line of code creates a new column in the DataFrame called Sales $, and fills the column with the calculated sales values in the sales variable. Two more lines of code can be inserted to calculate and display the GST amount in a column called GST $ — see Figure 9.
These new lines demonstrate a few Python coding practices that are explained below.
Snake case
Variables are usually created in lower case. The underscore character is used to separate multiple words in variables, e.g. gst_amount. This is called snake case. Variables can’t contain a space. In general, it is encouraged to use descriptive variable names and avoid abbreviations, e.g. use gst_amount rather than gst_amt.
Equals signs
In Python, when checking if something equals something else, you must use two equals signs, not one. A single equals sign is used to make something equal something else, mainly used for variables.
Rounding
There is a rounding function in Python. Using gst_amount.round(2) rounds the variable value to two decimal places.
GST amount calculation
In the line of code below, the statement (df["GST"]=="Y") returns True if Y is in the GST column and False for any other entry. The result needs to be enclosed in parentheses so that when it is multiplied, the True is converted to 1 and False is converted to 0. This has the effect of zeroing the GST calculation when Y isn’t in the GST column.
sales * 0.1 * (df["GST"]=="Y")
Referring to Python cells in Excel formulas
The Python table in cell C1 can be referred to using the standard dynamic array # reference. In this case, C1#.
In Figure 10, the Excel formula in cell K1 uses the VSTACK function to combine the header row (extracted with the TAKE function) with rows filtered when GST equals Y.
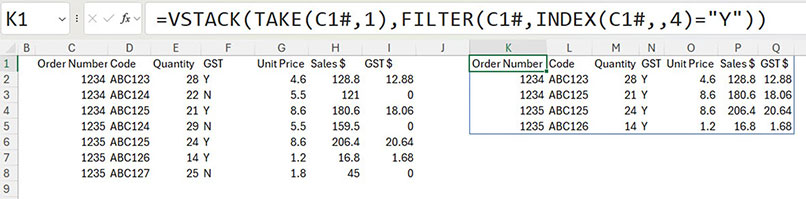
This shows that you can use Python to create tables, and Excel standard functions and formulas to refer to it.
Pandas functionality
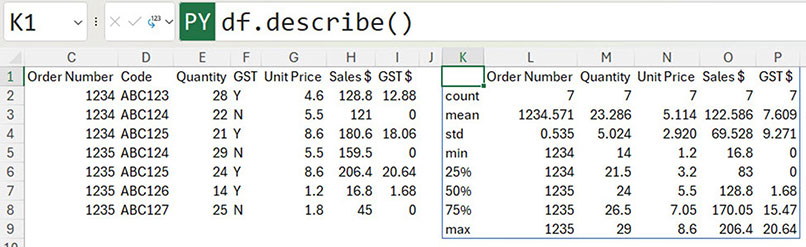
The Pandas library has many built-in data features that can be useful in analysis. As an example, Figure 11 shows the describe() method in the Python cell K1, providing a summary of the sales table in variable df.
This shows that you can use Python to create tables, and Excel standard functions and formulas to refer to it.
Pandas functionality
The Pandas library has many built-in data features that can be useful in analysis. As an example, Figure 11 shows the describe() method in the Python cell K1, providing a summary of the sales table in variable df.
The Pandas library has many built-in features that can make working with data easier, and part 3 of this series will examine more features of the Pandas library.
The companion video and Excel file will go into more detail to demonstrate these techniques.