Excel tips: Python in Excel — sentiment analysis


Loading component...
At a glance
Excel works well with numbers and text, but it cannot interpret text like language-based models. This is where sentiment analysis comes in.
Sentiment analysis reviews and scores text for negative or positive comments. The scoring range is between -1 (negative) and 1 (positive) with zero being neutral.
Sentiment analysis is commonly used to analyse social media posts, but it can also be used to review general, survey or training feedback and other short text reviews or comments.
Text-based data is increasing and being able to quantify text comments can help analyse customer or training feedback. Results could be reviewed and scored to see trends over time.
Excel cannot perform sentiment analysis but Python in Excel can. Python in Excel was introduced and covered in three prior articles: part 1, part 2 and part 3. This article assumes basic knowledge of Python in Excel.
Python in Excel has access to external purpose-built libraries that add functionality to Python. A Python library that includes sentiment analysis is called NLTK (Natural Language Toolkit). It has a sentiment analysis feature called VADER (Valance Aware Dictionary and sEntiment Reasoner).
It understands social media posts including slang, capitalisation, punctuation and emojis. These features and functionality can be imported into Python in Excel. This library provides an independent analysis of text.
Limitations
Sentiment analysis is indicative not definitive. It is useful for high level reviews of large quantities of text-based data. Scores can misread sarcasm, jargon or mixed sentiments. It is more accurate for shorter text. Sentiment analysis should assist human reviews, not replace it.
Reviewing scores in isolation might not mean much. When aggregated and reviewed over time and compared to other metrics, they may help to identify trends or relationships.
Python code entry

To enter Python code, you need to first type =PY and press Tab. The other option is to click the Python icon on the Formulas tab (Figure 1).
To accept the code press Ctrl + Enter or click the tick icon in the Formula Bar.
Feedback text data
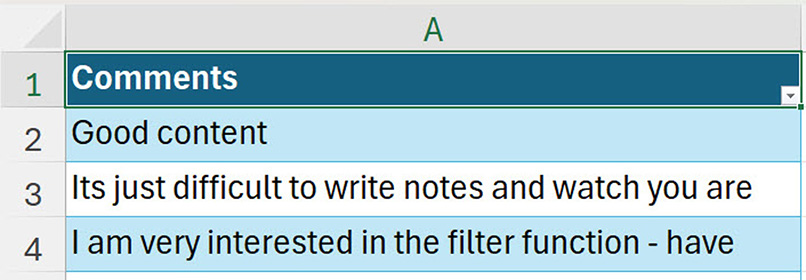
The example data is in a single column table of feedback comments. The table is called tblComments. See Figure 2.
Setting up
The NLTK library must first be imported. The SentimentIntensityAnalyzer then needs to be imported. The code in Figure 3 is entered in a separate sheet in cell B1.

The variable sia is used in the code that follows to refer to the SentimentIntensityAnalyzer. This provides a sentiment score for the text.
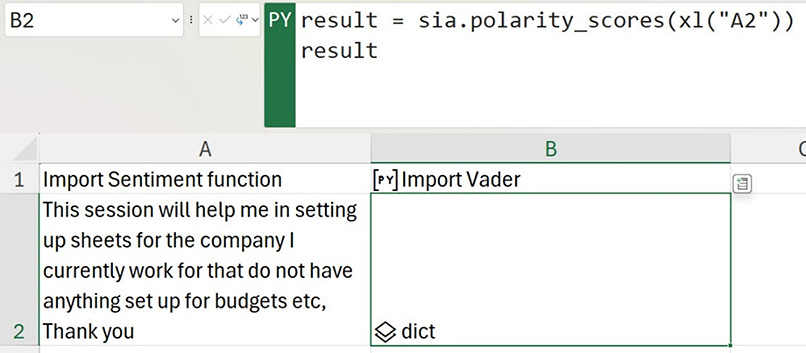
When the text is analysed, it returns a dictionary of results.
A dictionary is a data type within Python that can store multiple results. The Python code in cell B2 returns a dictionary of results based on the review text in cell A2 — see Figure 4.
One way to see the dictionary output is to convert it into a Python dataframe (table). Cell B3 demonstrates this – see Figure 5.
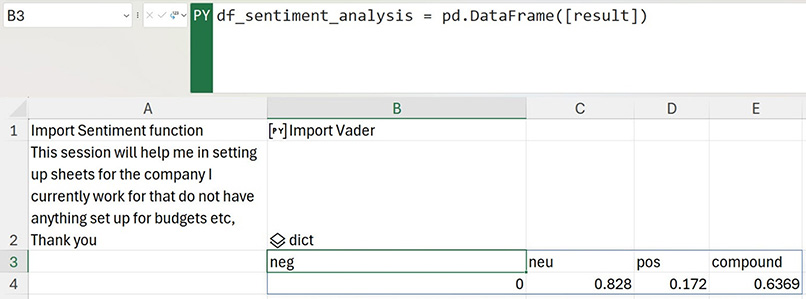
Note the reference to pd relates to the pandas library that is automatically loaded into Excel and referred to using the pd reference. The pandas library is dedicated to data handling and analysis. (The pandas library was explained in the previous Python articles.) Note: a dataframe in Python is a table in Excel.
The compound score (0.6369) is the overall score based on the other three values. The compound score is a scale from -1 to +1. Minus one represents highly negative, 0 is neutral and plus one is highly positive.
Analysing single text cells is inefficient for Python in Excel processing.
We can analyse the whole table of text comments in one cell. Cell B6 has the code and is shown in Figure 6. I have added line numbers on the left to help explain the code below.
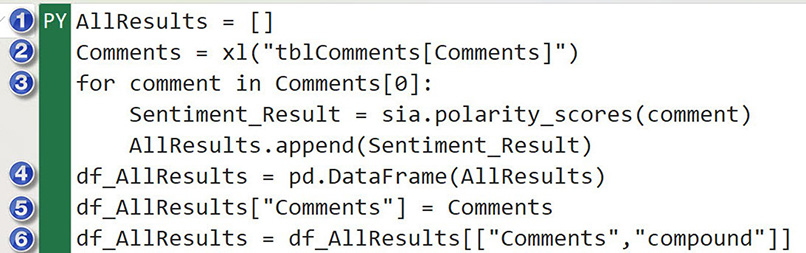
1. The AllResults variable creates a blank list. This list will hold each dictionary output for each text entry.
2. The Comments variable captures all the comments from the formatted table called tblComments.
3. This is a programming structure called a “for each loop” that loops through each comment in the table. The [0] represents the first column in the table. Python indexes start at zero, not one. The “for each loop” performs two processes per comment.
3.1 First the sentiment score is captured in the Sentiment_Result variable.
3.2 The variable is appended (added to the end) to the AllResults list. This builds a list of dictionary results.
4. The variable df_AllResults is a data frame that converts the list of dictionaries into a dataframe using the pd.DataFrame function.
5. This command adds a new column to the dataframe with all the comments.
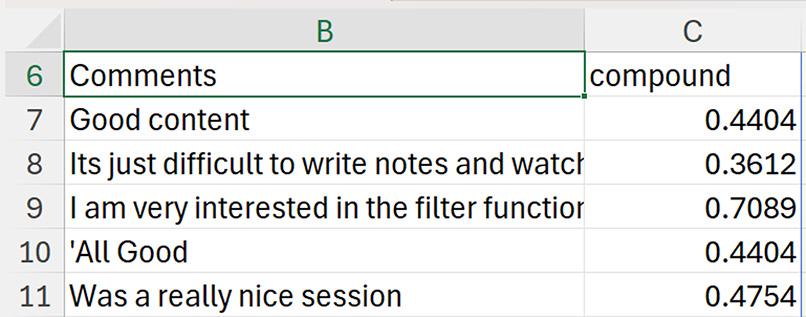
6. This command amends the dataframe so that it only has two columns with the Comment in the first column. (Note: compound is the name of the score we want to capture — see the last column in Figure 5).
The output can be seen in Figure 7.
Sentiment analysis
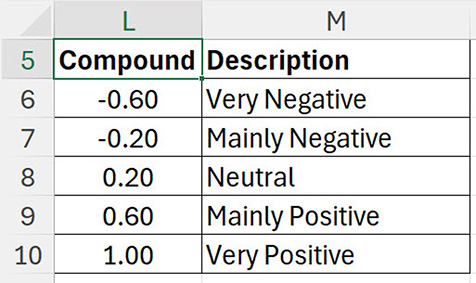
Now that we have a score for each comment, we can perform sentiment analysis. We want to return one of five entries. The table in Figure 8 has the values and descriptions used to evaluate the scores.
The values and descriptions can be changed in the table to suit requirements. The table is sorted in ascending number order.
Completed table
To add a description column to the Python table we can use standard Excel functions. The formula in cell H6 is shown in Figure 9. The line numbers have been added on the left for explanation below.
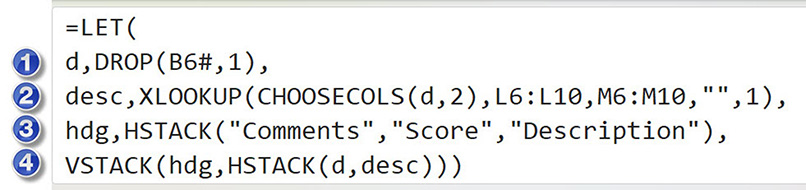
- The d variable captures only the data rows from the Python table in cell B6. The DROP function removes the header row.
- The desc variable captures the result of XLOOKUP. The score’s description is extracted from the table in Figure 8. The ,1 at the end of the XLOOKUP function uses the exact match or next larger option to extract the correct description from the table.
- The hdg variable creates the headings for the output table.
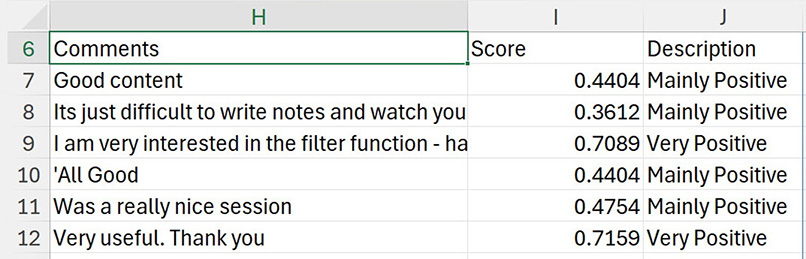
- The VSTACK function joins the headings to the three columns created by the HSTACK function. The HSTACK function combines the Python data (two columns) with the description column. The final output table is shown in Figure 10.
Python solution
Python in Excel provides a straightforward solution to add sentiment analysis to Excel. Being able to quantify text comments enables independent analysis of text-based data sources.
The companion video and Excel file will go into more detail to demonstrate these techniques.