Loading component...
At a glance
By Glenn Rees and Lachlan Colqhoun
Machine learning and AI might be grabbing the headlines, but a business intelligence (BI) system is still the go-to tool many organisations rely on to guide their business decision-making.
In fact, BI and analytics are increasingly being used together to gain more powerful insights into business and market data.
Whether you need these advanced tools or a quick and easy way to track business KPIs, there’s a broad range of BI systems to choose from.
The evolution of BI
BI systems used to typically deliver historical snapshots of performance, but today’s tools allow unprecedented flexibility around future modelling.
They can deliver insights in areas such as the risks of new product launches, or pinpointing the most profitable markets.
Significantly, they can be easily used by the everyday employee.
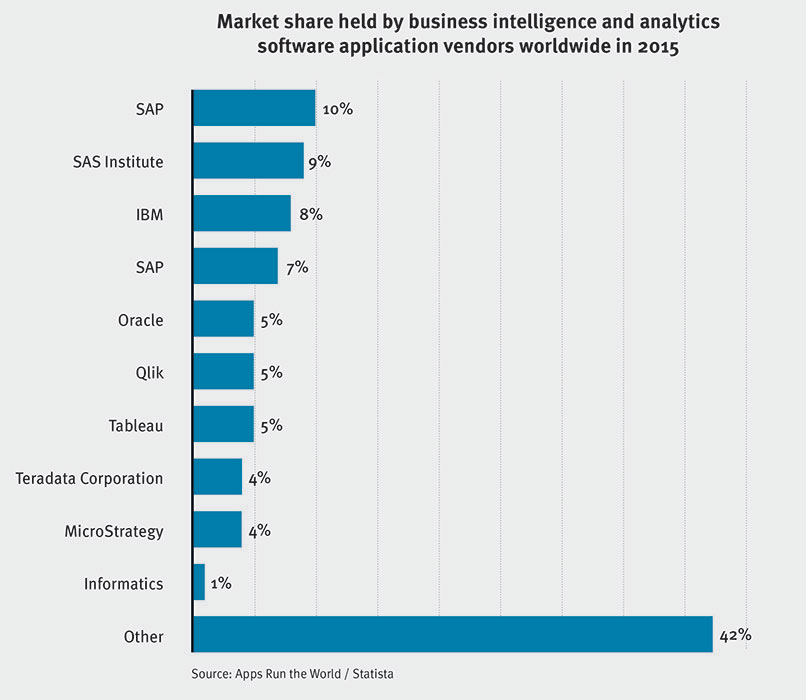
BI is a highly competitive market among vendors, with established players such as SAP, Oracle, SAS and IBM being challenged by a new generation of providers.
Gartner’s Magic Quadrant for Business Intelligence and Analytics Platforms report, includes a host of names less than a decade old, and another of its recent BI reports lists 141 different solutions.
Vendors such as Tableau and Qlik might not be household names, but they are named in the leaders’ quadrant by Gartner, while Microsoft has come from nowhere in this sector a few years ago to also being a leader.
“We’ve actually seen huge disruption in the last 10 or 15 years, and I think we are embarking on the third wave of change in BI,” says Ian Bertram, a managing vice president at Gartner.
“The first wave was very IT led. It was around reporting and the better management of data, and getting insights from the great, robust, semantic technologies which have been built over the last 50 years,” he explains.
“Then came the ‘heel biters’, the innovative organisations. This second wave was very business led and reactive; [it came from] people in the business who didn’t think IT was reacting fast enough, so they went off and did their own thing.”
This second wave comprised new visualisation tools which were also self-service; it included Qlik and Tableau, which Bertram calls “darlings of the street”.
The third wave of BI systems, which is building now, is growing off machine learning and artificial intelligence (AI) in the era of big data.
The challenge now for BI is to reach out to big data, sift through it using techniques such as machine learning, and deliver relevant results to desktops and mobile devices in usable and highly visual formats.
To be successful, these tools must play into the trend Bertram calls the rise of the “citizen data scientist” within the organisation.
“This is the new paradigm,” he says.
“It is about the increasing skills of the general population within an organisation as they start to use more data and visualise it.”
"We've actually seen huge disruption in the last 10 or 15 years..."
Gartner’s forecast is that the Australian market for BI and analytic solutions will reach A$889 million in 2017, up 13.4 per cent on 2016.
At Deloitte Australia, Lee Anderson is a partner in the Analytics and Information Management practice and leads the firm’s information delivery capability.
Like Bertram, Anderson sees democratisation of BI as the big trend of the last decade.
“There has been a big rise in user-centric, highly visual BI tools,” says Anderson.
“These have been sold into the front line of business users to allow them to bypass these monolithic enterprise data platforms and access data stores themselves, or take advantage of disparate data centres from across the organisation.
“These tools such as Tableau and Qlik are democratising BI and putting it into the hands of business people, and the tools themselves have some very attractive features which make is easier for people to build their own dashboards and BI reports.
“The coupling of BI and reporting and visualisation tools is working hand in hand in a data science role to deliver predictive and cognitive models targeting different types of use cases.
“This is about people wanting to look at dashboards on their iPads and being able to interact with them in real time, or dashboards in frontline call centres which enable [those centres] to act on data to execute their processes,” says Anderson.
With the integration of machine learning into a more democratic BI, it will be interesting to see how these tools influence business decision-making in the decades to come.
What to consider when choosing a BI platform
The BI platform you choose depends on your needs, and there are a number of key factors to consider.
First, there’s no point getting a powerful BI solution if it can’t access your key business data, whether that’s a SQL database, accounting transactions, details from the customer relationship management (CRM) system or even social media feeds.
All good BI systems support a broad array of data sources, but they differ in how easy it is to gather that information and keep it updated.
Similarly, the better tools now offer advanced features such as real-time analytics of live data, and predictive analytics for identifying likely future trends but, again, they differ in how these features are implemented.
"There has been a big rise in user-centric, highly visual BI tools."
The value of a BI system is in how well its dashboard lets you visualise the data in easily digestible formats such as charts, and then interact with that data to drill down into more granular information.
Also important is whether the application is self-service – how easy it is for everyday users to gather and visualise data without help from data scientists or IT staff – along with the ability to integrate different data sources so, for example, you can connect the dots between your accounting and CRM data.
Popular BI applications
Microsoft Power BI

Before BI software, most users in organisations just used Excel to extract meaning from data – and many still do.
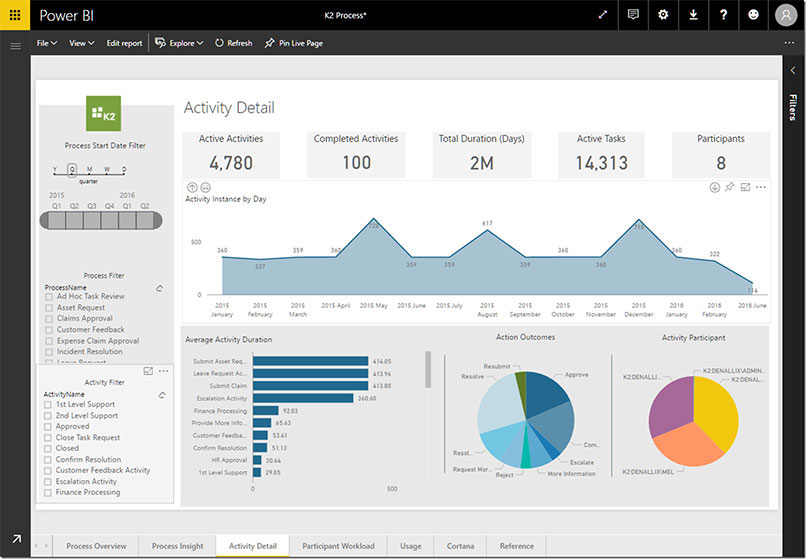
It’s hardly surprising that Power BI started life as an Excel add-on, but it’s evolved into a powerful, yet relatively easy-to-learn, self-service BI system with real-time and predictive analytics and other advanced features.
Power BI supports a wide range of data formats but, as you’d expect, one of its strengths is how well it integrates with Microsoft products such as Office 365.
Power BI is a Windows desktop application, although you can publish and share via the cloud. The good news is the standard version is free and the Pro version, with additional collaboration features, is very affordable.
Pricing: Power BI Desktop: free; Power BI Pro: A$12.70 per user per month; Power BI Premium: A$6350 per server per month.
Qlik
Qlik is one of the better examples of the many specialist BI providers. Qlik Sense is its self-service app that makes it relatively easy for regular business users to discover, analyse and visualise a wide range of data.
The company also offers a more powerful, guided analytics tool, QlikView, and its comprehensive Qlik Analytics Platform for enterprises.
Qlik Sense and QlikView are available as both cloud and desktop applications (desktop for Windows only).
Qlik offers personal versions of each for free, while the commercial version of Qlik Sense Cloud for teams is competitively priced.
Pricing: Qlik Sense and QlikView for individuals, free; Qlik Sense Cloud for groups, US$25 per user per month; other products, price on application.
Tableau

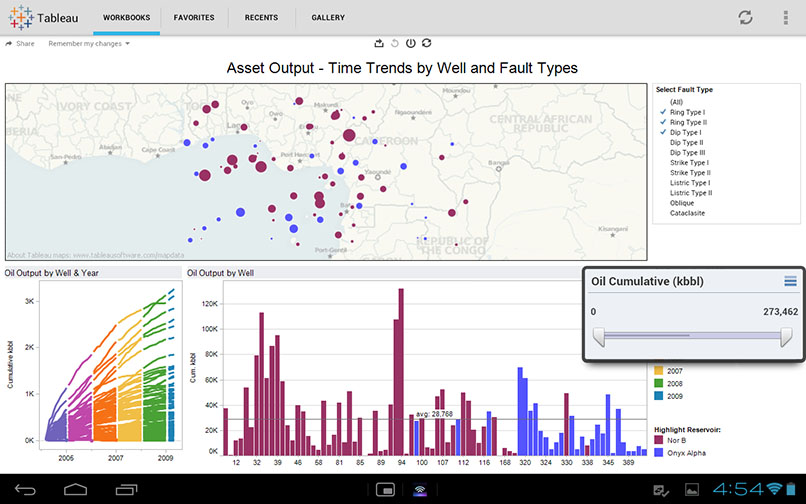
One of the original self-service BI applications, Tableau sets the standard as a powerful tool that offers a variety of ways to visualise and explore all the usual data formats, along with advanced real-time and predictive analytics.
Its interface is quite intuitive, although it’s not as easy to learn as Power BI.
Tableau is also a desktop application (for Windows or Mac), and its pricing reflects its position as a market leader.
Pricing: Tableau Desktop Professional (for Windows or Mac), US$840 per user per year; Tableau Server, US$420 per user per year; Tableau Online, US$504 per user per year.
Other options
Power BI, Tableau and Qlik are just some of the many options in the BI market. Along with a host of newcomers, established players such as SAP, SAS and IBM are also popular, especially among large enterprises.
IBM
IBM has added the more accessible, cloud-based Watson Analytics to its traditional products such as Cognos.
One of Watson Analytics’ more notable features is its ability to query data using natural language, allowing for a better understanding of the complexities of human language that arise in unstructured content such as news articles and blogs.
Oracle
Oracle’s powerful data visualisation and business intelligence tools are favoured by organisations that use other Oracle enterprise software.
Salesforce
Although primarily known for its customer relationship management (CRM) system, Salesforce has diversified into other areas, including BI.
It offers a range of cloud-based apps but most notable is Einstein Analytics, which offers machine learning and integration with Salesforce CRM.
SAP
SAP’s BusinessObjects is the go-to tool for organisations that use SAP’s enterprise resource planning (ERP) software. Its SAP Analytics Cloud is a more affordable, cloud-based, self-service BI app.
SAS
SAS specialises in BI and analytics software, with its products ranging from a self-service visualisation tool, Visual Analytics, to powerful specialist tools for data scientists and industry verticals.
Zoho
Zoho Reports is a relatively easy-to-learn, inexpensive cloud BI application designed primarily for small and mid-sized businesses. It integrates well with Zoho’s other cloud applications.


