Loading component...
At a glance
More than two-thirds of enterprise data is not used in any way, according to a study from IDC-Seagate.
Business intelligence (BI) software can help reduce this wastage by making it easier to identify trends and gain insights from a variety of data sources. BI software can automatically create charts and other “visualisations” from structured data.
All BI tools are different, but most typically allow a user to upload files – such as spreadsheets – to connect directly with data in cloud accounting, customer relationship management and other applications.
Visualisations are typically pulled into customisable dashboards for different users or functions. Some “self-serve” BI apps make this relatively easy for regular business users, removing the need to depend on data scientists or analysts.
Data & Digital micro-credentials
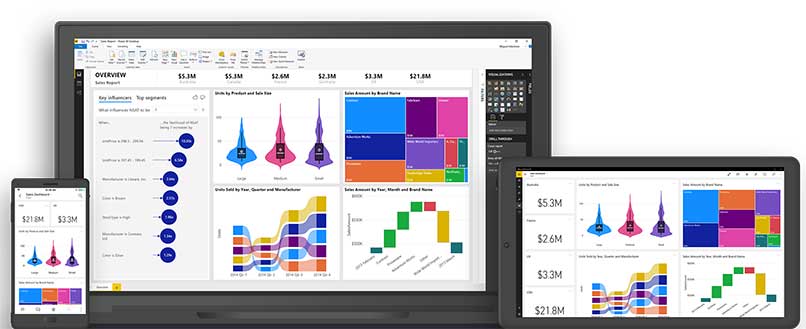
1. Power BI

2. Tableau

Now owned by and integrated with Salesforce, Tableau has long set the standards for BI. Tableau offers a broad range of data connectors and interactive visualisation options, advanced analytics.
3. Power Metrics

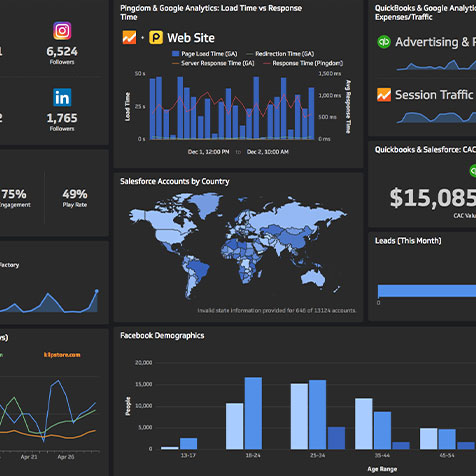
Klipfolio’s self-serve Power Metrics app is suitable for smaller businesses and is available free and on subscription. Power Metrics has a Xero add-in that simplifies creating dashboards from accounting data.
4. Qlik Sense
A powerful visualisation and data analytics platform, Qlik Sense also uses artificial intelligence (AI) to help users improve their data literacy and even create machine learning models without coding.
5. ConverSight
ConverSight offers interactive BI and visualisations with a difference – it uses AI, so users can key in natural language queries to gain instant insights.
6. Datawrapper
For those who need data visualisations but not full‑blown BI, Datawrapper is a solid option. Users upload a spreadsheet or connect to a data source to create an interactive chart, map or table. Datawrapper also offers a fully functional free plan.
Buying checklist
- Data connectors. Users should make sure their chosen BI tool can connect to the most commonly used data sources at their workplace, and that the tool’s upload capability is right for them.
- Visualisations. Chart and visual representations of data can vary, so check what is needed. For example, some users may want a tool that generates interactive visualisations that allow viewers to zoom in and examine specific data points.
- Self-serve capabilities. Ease of use is important, so find out how easy it is for a regular business user with minimal prior knowledge of the tool to create their own data visualisations and dashboards.
- Data merging and shaping. Powerful insights can be unlocked by combining data from two or more sources. Check how easy it is to do that and then “shape” or refine the data so it can be used by the BI tool.
- Data analytics. Some BI platforms offer powerful ways to analyse data, including predictive analytics and even machine learning for sophisticated forecasting.

