Loading component...
At a glance
Power BI is Microsoft’s business intelligence package. You can import raw data and create reports and dashboards by using its drag and drop functionality. Creating reports and dashboards is similar to using PivotTables in Excel. Power BI has a free, fully featured desktop version and a subscription version that allows sharing and online use.
Frequent Power BI updates
Microsoft is pouring a lot of resources into developing Power BI. The frequent updates mean that settings could change and things may look a bit different as time goes by.
This is different from Microsoft’s previous software policy of releasing updates every two or three years. It requires a bit of a shift in attitude and you need to be more flexible in terms of working with Power BI due to the frequent updates.
Power BI is in constant development and some things you may expect to be straightforward may not exist yet. For example, the ability to copy and paste between Power BI files has been added only recently.
Don’t let this be the reason you wait to start using Power BI. The earlier you start to use it, the quicker you will learn it and the sooner you will benefit from its power and amazing capabilities.
Let’s review some of the more useful updates that have occurred in the last couple of years. These updates are in no particular order.
Note: Some things that are being added to Power BI have been in Excel for many versions. Links are included to detailed articles on topics. There are more general resource links at the end of the article.
In Preview
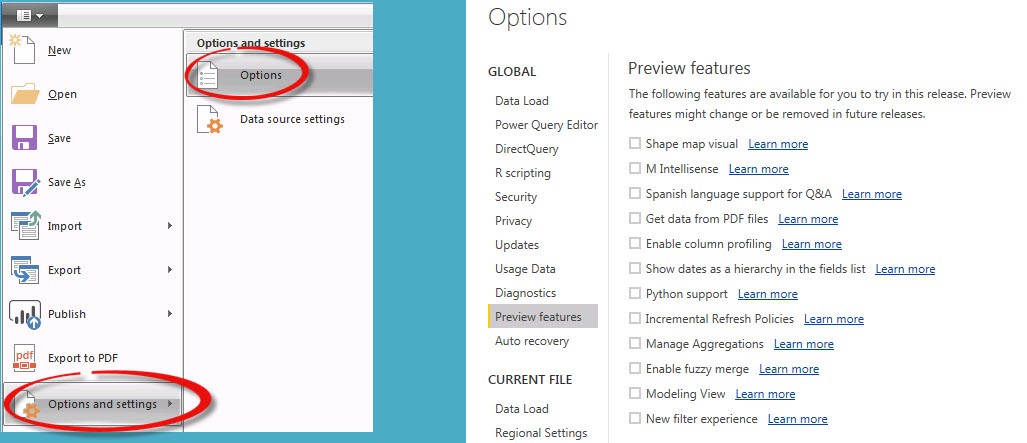
Some new features first come out in Preview but they need to be turned on in the Options section under Preview features; see Figure 1 below.
Q&A functionality
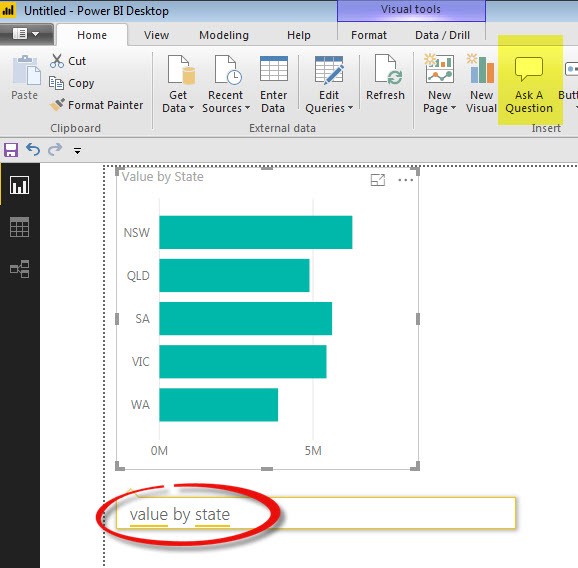
You can type in a question and have Power BI automatically create a chart to answer your question. As an example, in Figure 2 I clicked the Ask A Question icon on the Home ribbon and typed “value by state” in the box that opened. You can also double click on the canvas (the blank space where charts/reports are created) to open this feature.
Both Value and State are fields (columns) within the data. Power BI created a Bar chart showing the results.
Conditional Formats
Yes, Excel has had them for years, but they are new to Power BI. You can change formats based on values or values in other fields.
Data connections
There have been many new connections added including SAP. Recently a PDF connector has been added but is still in Preview mode at the time of writing. New connectors are being added each month.
Quick Measures
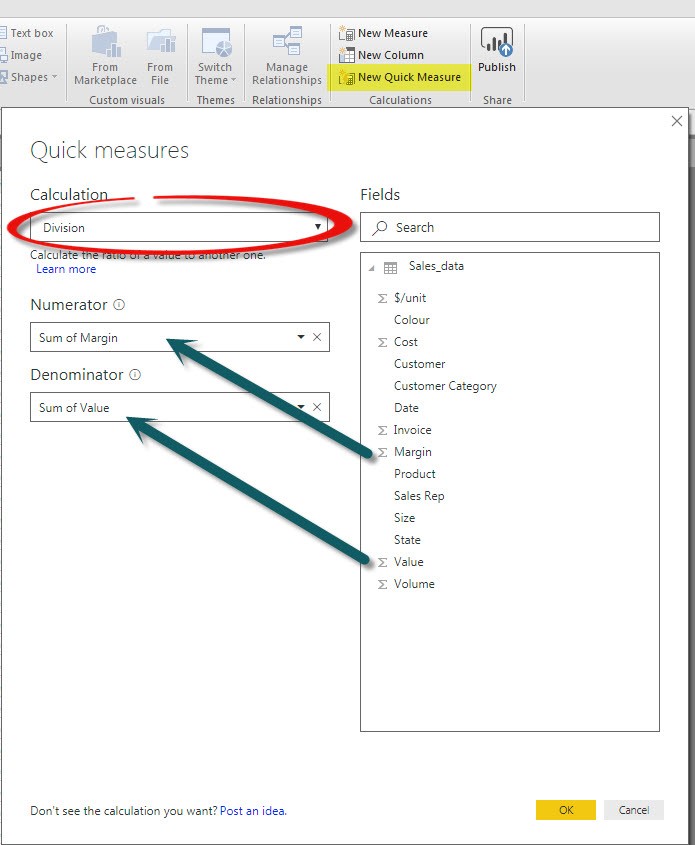
Measures are an important part of creating robust and easy-to-use reports. Quick Measures simplify the process of creating measures. In Figure 3 I have opened the Data View and clicked on the New Quick Measure icon, and in the Calculation drop down I have chosen Division and then dragged the fields I wanted to use to the Numerator and Denominator sections. This creates a margin per cent calculation.

In Figure 4 I have amended the measure’s name to make it more descriptive and then added a default value for the DIVIDE function that will display a zero if the denominator is zero, and avoids an error for dividing by zero.
Copy and paste
You can now copy and paste between Desktop files.
Custom visuals
New custom visuals are added each month. This is a double-edged sword as the more visuals there are, the harder it might be to find the right one. In general, keep your charts simple when you start to use Power BI and then try a few more types when you become more confident.
Fuzzy Matching option for merging
When combining data from multiple tables, codes may differ slightly. For example, one code may be ABC-123 and the other table may have ABC123. In standard merging operations this difference would not allow you to merge tables together.
Fuzzy matching is more liberal in how it applies matching. The above example would be handled correctly. This can save you having to create a mapping table to merge the two tables together.
As at the time of writing this is a Preview feature (mentioned above) that needs to be turned on.
Power Query improvements
Power Query allows you to clean data and import it into Power BI in one step. Power Query automates the importation process. It uses basically the same interface as used in Excel. Excel’s Power Query can be the gateway drug into Power BI as Power Query gets you used to preparing your data.
Power Query has a new feature called Add Column From Example. You can enter the results that you want to see in the first few rows of a new column and Power Query will attempt to write code to perform that transformation based on another column.
The language that Power Query uses to perform transformations is called M. You don’t need to know it to use Power Query but to do more complex transformations you may need to use it. M Intellisense is in Preview mode and it prompts you with possible options as you type the code. This should make using the M language easier in the future.
What If parameters
These allow you to set up a parameter that the user can modify via a slicer for example. That parameter can then be used in a measure to calculate different scenarios based on the existing data. Parameters are in the Modelling tab.
Bookmarks
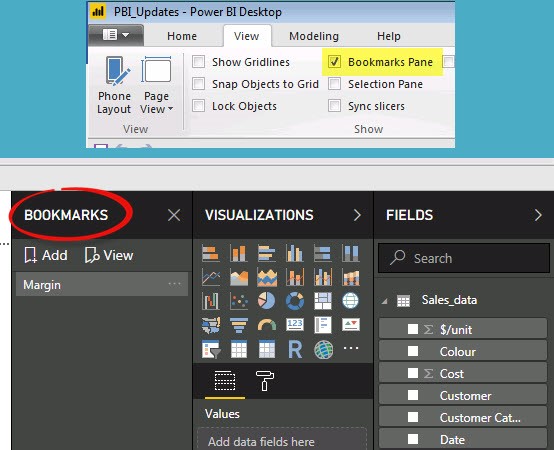
These allow you to capture a report including filters and save it as a bookmark. You can then return to the report by accessing the bookmark. Bookmarks are displayed on a pane on the right of screen. You can display the Bookmarks Pane via the View ribbon tab; see Figure 5.
You could save a series of bookmarks and then go through them in sequence to tell a story or present an argument. Buttons, mentioned next, can open a bookmark.
Buttons
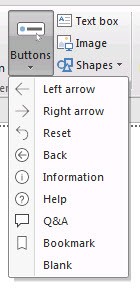
You can create buttons to allow the user to better interact with the report. There are default actions like moving to the left or right page. You can also link to a bookmark mentioned above. The Buttons drop down from the Home ribbon is shown in Figure 6.
Slicers
You can now use numeric Slicers. Slicers are filter interfaces that allow the user to quickly and easily filter a dashboard or report. Excel uses Slicers for PivotTables and formatted tables.
New DAX functions
DAX is the function/formula language for Power BI and PowerPivot in Excel. The DAX editor has been updated, and new functions are added regularly. More statistical functions have been added recently. To get the most out of DAX a knowledge of relational databases is helpful.
Export to PDF
You can now export Power BI reports to a PDF file and also print them.
Filtering and sorting in Data view
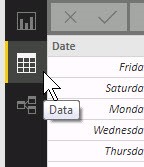
It is amazing that this is a new feature, but you now can filter and sort in the Data view of tables. The Data view is the second icon on the left of screen; see Figure 7 below.
R and Python
These are separate programming languages used to handle and report on large data sets. You can use R scripting within Power BI, and the Python language support is a Preview feature at the time of writing.
All updates
You can find out more details on the latest and past updates at the links below.
Previous monthly updates to Power BI Desktop
Microsoft Power BI Blog
Additional resources
Below are some great blogs where you can learn more about Power BI and the modern Excel Data Model plus Power Query.
Excelerator Blog
powerpivot(pro)
The Excelguru Blog
Chris Webb's BI Blog
THE BICCOUNTANT
RADACAD Blog

